Central London overview
London has continued to strengthen through the year and occupier take-up has increased by approximately 2 million sqft in the third quarter (10% increase on the previous quarter). Regardless of this increase, take-up performance is still 19% the Q3 average. Leasing volumes have been driven by transactions in the City submarket where the strongest performance has been recorded since 2019 and accounted for 65% of the total transactions in Q3 2023.
The increase in take-up has been driven by three larger transactions exceeding 100,000 sqft which were 170,000 sqft (Kirkland & Ellis), 127,000 sqft (ICE Futures) and 109,00 sqft (John Lewis) which illustrates that the demand for office space is still there. Transactions suggest that there is an equal split between new furbished stock, refurbished stock, second hand space and pre-lets which is consistent with performance over the last two quarters. Over 6 million sqft has been transacted year to date which was roughly 20% lower than 2022 and 15% lower than the 10-year target. Leasing volumes have been driven by smaller, churn activity with 85% of transactions being sub 25,000 sqft. This is driven by the occupiers re-evaluating office footprint due to hybrid working and the economic climate.
Transactions are driven mainly by the service industry with 30% of overall deals being within the sector. Flexible workspace continues to show its resilience, activity, and demand by 195,000 sqft of leased space being to flex operators in Q3. Despite signs of improvement and recovery, the spaces current offer will only allow for an anticipated transactional level of 8.5 million sqft for 2023 which is approximately 1.8 million sqft lower than the 10-year average.
Activity is clearly still there but the data suggests that transactions are subservient to the ever-changing workplace policy and the volatility in the economy.
Market Rents
Limited superior quality supply led to further prime rental growth over the third quarter. Prime headline rents increased by just over 3% in the city market – from £75.00 per sqft to £77.50 per sqft. The year-to-date growth has now been just under 7%, which is on par with annual growth recorded just before the pandemic began. Marginally stronger rental growth was recorded in the West End, where prime rents increased by almost 4% during the quarter from £130.00 per sqft to £135.00 per sqft. As a result, annual growth of 8% was recorded. Prime rents in East London remained unchanged for the fourth consecutive quarter at £55.00 per sqft.
The competition for space in the core is supporting the growth of neighbouring sub-markets, leading to increased demand and higher rents in several submarkets over the quarter. Over the quarter, several submarkets, including City Eastern, City Western, Shoreditch, North of Oxford Street, and Victoria, experienced quarterly rental increases.
Prime rents in the city continue to rise. In the City Core, prime rents increased by 3.3% to stand at £77.50 per sqft, which is a historic high. City Eastern, City Western and Shoreditch also recorded quarter-on-quarter increases, in line with the core. Only Midtown, City Southern and Aldgate lag the City Core from a rental perspective.
Whereby, second-hand stock that does not have a significant USP has decreased significantly in the last quarter with landlords worried about lengthy void periods due to large swaths of competition. This has been seen across submarkets in central London.

Leasing activity
Despite various external concerns to do with the economic climate, Q3 is the strongest of all quarters in 2023. Occupiers have reached highs of circa 2.4 million sqft, which is a circa 12.5% increase from the previous quarters.
As discussed, despite this strong quarter, volumes are circa 20% below the long-term average which is circa 3m sqft. This increase in leasing volumes was down to the influx of deals within the city market which experienced its strongest performance since 2018. To put this into perspective, the city market alone accounts for 65% of Q3 total volumes.
The City itself was dominated by a revival of larger transactions, with 3 transactions all over the 100,000 sqft mark. This tells a vastly different story to that of the previous quarter were no such transactions were recorded. The largest deal of the quarter and of the year is the Kirkland & Ellis transaction at 40 Leadenhall Street, EC3 where they took 170,000 sqft. This was closely followed by Ice Features which acquired 127,000 sqft in the recently refurbished Sandcroft building, EC1. Finally, John Lewis’ acquisition of 1 Drummond Gate, SW1 as their new office headquarters amounting to 109,000 sqft.
In total, we have seen circa 6.5 million sqft being let in the year to date. This is circa 23% below the YOY period which stands at 8.5 million sqft and 15% below the 10-year average of 7.5 million sqft. It’s apparent that much of the activity to date has been driven by smaller transactions, with 90% of the last 9 months deals (up to October) being sub 25,000 sqft which is above the long-term average of 81%.
The service industry remains the strongest of all occupiers, as they continue to top the activity list for the 3rd consecutive quarter, accounting for a total of 30% of the total Q3 volume. Within this sector, the likes of Leisure and Retail became the most influential, contributing to a quarter of the total take up. The likes of John Lewis helped elevate these numbers.
Contrary to the latest news regarding WeWork and their apparent demise (the US business going into Chapter 11), the flexible workspace sector remained active with circa 200,000 sqft leased in Q3. On the contrary, the TMT sector dropped by 9% when compared the previous quarter, leasing a total 215,000 sqft. For comparison, the sectors long term average is 23.50%.
Despite this uncertainty, there continues to be an ongoing norm. Under offer leasing activity remains at record highs, as the legal process becomes increasingly protracted.
Vacancy rates and availability
In Q3 of 2023 available supply increased by just 1% overall. Overall, new build and refurbished supply remained stable, with the increase largely due to more second hand stock coming onto the market. Overall, Central London vacancy rates marginally increased by 0.2% to 9.6%, with new build vacancy remaining at 1.6%.
The market balance has shifted over the quarter, with take up in the city surging. This combined with a slowing rate of speculative development completions lead to supply in the city dropping, with vacancy rates falling from 9.7% to 9.5% in Q3. West End supply marginally increased for the 4th consecutive quarter, due to increases in new and refurbished stock. Vacancy rates sat at 8%, while new build vacancy rates increased to 1.6%. This unusually sits above the new build vacancy rate in the city at 1.4%.
Sales Market
The Investment and sales market is continuing to struggle within the capital and is illustrated by a further reduction of 23% from Q2 of 2023. To quantify this, the total value of sales across London was £1.1 billion – highlighting a total volume 62% lower than the 10-year Q3 average of £3.0 billion. Activity in the quarter was driven by the city market, seeing £792 million in volume compared to £330 million across the West End.
Overall volume for the year has now reached £4.8 billion, representing a reduction of 50% when compared to same period in the previous year (£10.9 billion) and 46% below the 10-year YTD average of £9.0 billion. The lower transactional volume is due to the absence of larger transactions. Sitting 18% below the long-term YTD average, the average transaction size sat at £54.2 million for 2023 YTD, compared to £80.4 million in 2022. 71% of the turnover was below £50 million, surpassing the 10-year average share of 65%.
Development pipeline
Supply increases remain sluggish.
The momentum of available supply stagnated over the period, increasing by just 1%. Second hand stock saw the only real increase with new build and refurbished stock remaining flat. This saw overall Central London vacancy increase by 0.2% from 9.4% to 9.6%. On the back of some sizeable transactions, take-up in the City saw vacancy levels fall 0.2% from 9.7% to 9.5% and with new developments starting to dry up, so we expect the City vacancy rates to decrease over the next 12-18 months.
Of the new developments, The Carter in EC4 was the most impressive addition to the market bringing 70,000 sqft of best-in-class space to the market. In the West End, there was an increase in refurbished and new stock which led to an overall vacancy rate of 8.0%. With the economic uncertainty mixed in with higher construction costs and restricted finance, so we see further delays to new construction which will cause a shortage in new developments beyond the next 24 months.

Industry analysis
Our Q3 has been our best quarter to date both for new enquiries and for completing deals. Within those deals, following a similar pattern to the previous quarters, we saw a great mix of sectors finalising their office strategies, be that moving on to new space (predominantly pre-fitted requirements) or for the most part, taking advantage of their lease breaks/expiries to renew on better terms with added flexibility, where they are.
The standout sectors for movement with us was Finance (inc. Fin-tech), closely followed by Not-For-Profit and then a healthy mix of the usual suspects from Technology & Education through to Energy & Insurance.
UK equity fundraising is still well behind where we were last year with Q3 seeing 470 deals completed (half of which to firms based outside of London) and down £400m on the previous quarter. Mostly due to investor caution around the cost-of-living crisis and high interest rates. UK firms accounted for 5 out of the top 10 deals in Europe with a nice mix of sectors from AI & Energy through to Pharmaceuticals & Consumer Goods.
Whilst Investor confidence might still be erring on the side of caution, consumer confidence is rising – up 6% over the last 12 months. Deloitte reports this is because of easing inflation, high wage growth & low unemployment. We are nowhere near out of the woods yet however as this percentage growth does not reflect well across the board, with those on lower incomes still struggling with rising rents & higher food prices. Worth keeping a close eye on this side of things as this all has a huge impact on our great retail & leisure sectors, where spending is creeping back to pre-pandemic levels. Long may that trend continue and be supported with more and more firms enforcing stricter policies on the return of staff to the office.
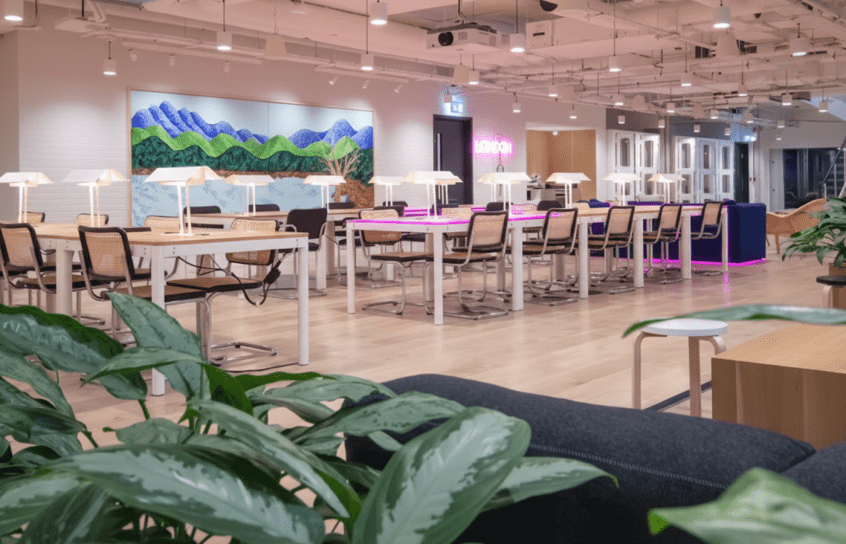
Flexible workspace
The London flexible office market continued to perform well in the third quarter of 2023, with take-up increasing significantly against 2022 as more businesses returned to the office post-pandemic. Many businesses have been drawn to the flexibility and affordability of serviced office space, as well as the high-quality amenities and services that are included.
Serviced office providers in London reported a strong increase in demand in the third quarter of 2023, with many businesses looking for flexible workspace solutions that could accommodate their changing needs. The West End remained the most popular location for occupiers, but demand was also strong in areas such as Midtown and Southwark. Companies searching for more affordable options have tended to venture towards Shoreditch, The City and Canary Wharf.
The outlook for the London flexible office market is positive, with businesses continuing to return to the office and look for Serviced and Managed offices.
Q3 2023 Round-up
So, what has Q3 2023 told us about everything? With inflation beginning to plateau and interest rates doing the same, wars in two different locations around the world and businesses looking to make cutbacks where possible, we’re starting to see the screw being turned on employees in respect of the ‘return to the office’ policy. It seems with every week that goes by, London is getting busier, especially Monday to Thursdays. The contrasting opinion with the public though, caused by the media, is that there should be lots of office space available as everyone wants less space, but the stats don’t lie and we’re seeing prime rents increase both in the City and the West End and the amount of second hand tenant stock is decreasing, as occupiers seek using their lease breaks and expiries to ensure they have the right amount of space for the new way of working.
Q3 has certainly turned into the best quarter of 2023 with the majority of the subjects spoken about above, other than investment, showing positive signs. The investment market though is still subdued and we’re beginning to see the larger firms shedding some of those agents whilst debt financing is proving expensive meaning fewer deals.
One key trend that SHB has seen a marked increase in, is in the world of managed office solutions, where occupiers (whether in serviced or conventional leases) are looking to find hassle free solutions to their office space. This is certainly prominent in the sub 5,000 sqft market where occupiers wrestle a market full of fitted out space via serviced, managed or leasehold routes. Landlords are now beginning to see the managed route as an easier way of reducing their void periods, investing in generically fitting out spaces for occupiers with short term minds. This is all well and good if occupiers are willing to investment more on amortising occupational costs over the years, however those occupiers unwilling to spend these levels of investment are beginning to find it difficult to find cheaper alternatives such as tenant stock.
Out of London, the suggested increase in people unwilling to go to larger cities and therefore flood the local provincial markets and rent space in out-of-town cities has not been evident and landlords in out of town markets are struggling to encourage occupiers to take space in their buildings, mainly because of the lack of amenities within the buildings or the high streets (with empty retail units).
What is in store for the remaining quarter of the year? While we’d all love to have a crystal ball, the likelihood will be much of the same as the rest of the year, however what doesn’t seem to be reported in the main stream media, probably due to other bigger ticket items going on around the world, is that many companies, big and small, are shedding their workforce – sometimes in their thousands – so surely this will start to have an impact on supply and demand, consumer and business spending habits and ultimately market pricing? We will have to wait to find out, but our view is that this won’t be until well into 2024. Hopefully it won’t last long with inflation lowering as well as interest rates eventually…however we have a couple of large elections looming at the back end of next year (US & UK) and the results from that could shape our industry for years to come.