Market activity, sector take-up, rent trends & predictions
If you’ve started looking for workspace in London, Q2 2025 brought a fast-changing and more divided rental market. Prime rents kept climbing in top areas like the West End and City, showing strong demand for high-quality, sustainable buildings. At the same time, more cost-focused businesses looked to fringe locations, where good space is still available at lower prices.
For businesses prioritising prestige, flexibility, or savings, knowing how rents are shifting across London is vital to making informed real estate decisions.
Here are some market stats to help support your next move…
→ First, some SHB client results from Q2
Money saved & Sq ft exchanged
£4,341,862 saved for clients
£11,175,461 saved for clients in the last 12 months
353,041 Sq ft transacted
501 desks moved | ↑ 120% up from Q1
60 new clients | ↑ 30% up from Q1
Our teams were busy working on acquisitions for clients across leasehold properties, managed offices and serviced offices around the UK. Building consultancy took a close second to the Q2 instruction split, with several long-term projects working on dilapidations assessments and negotiations.
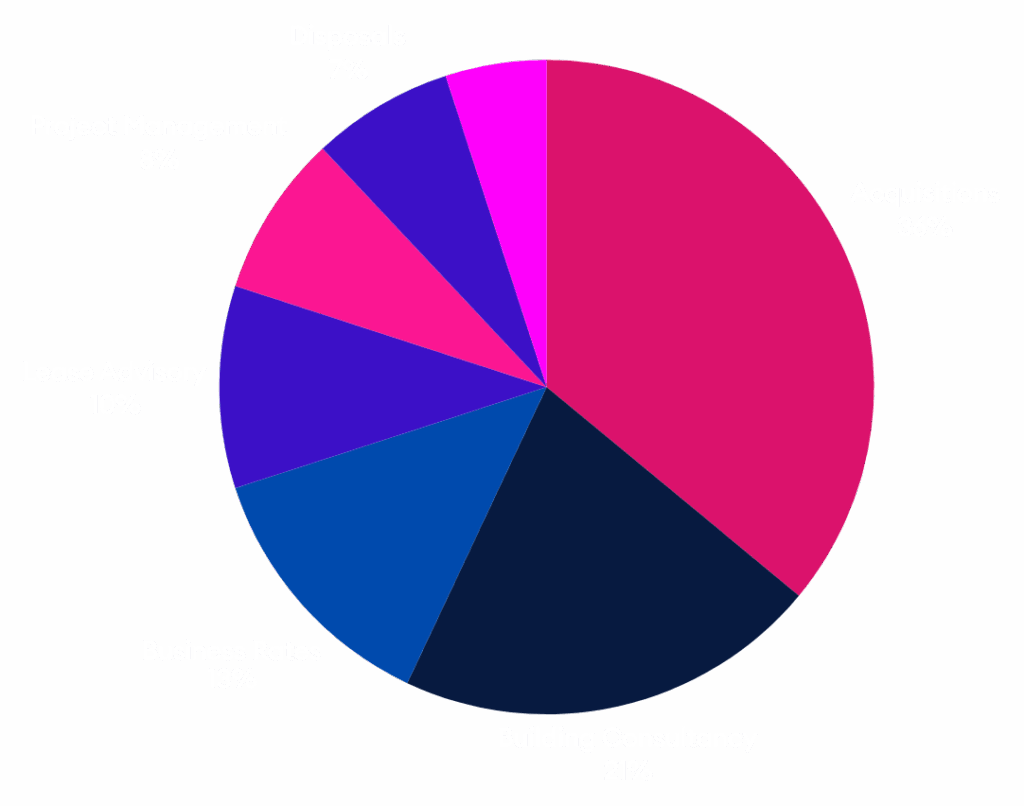
→ Q2 London office sector take-up @ SHB
→ Banking & Finance and Business Services made up over 40% of transaction work for us in Q2 2025, holding the trend for our largest sectors of client work.
→ Property & Real Estate doubled its share as developers and asset managers secured space ahead of repositioning and retrofit cycles and with some of our larger clients working on their workspace strategies.
→ Tech and Media demand remained subdued as firms reassessed needs, but interest in flexible space supply continues.
→ Retail, Hospitality, and Transportation increased activity compared to Q1, showing more sector diversity. Education and Law reduced modestly compared to last quarter for SHB, but still have plenty of projects in the pipeline.
Sectors We Found Offices For in Q2
SHB Deal Data

London Office Market Snapshot
We ran the numbers, followed market activity and spoke to a LOT of businesses. Here is what we saw…
Leasing Activity
→ Grade A and ESG-compliant space dominated, cited as much as 75%+ of all take-up, reflecting the ongoing “flight to quality”.
→ Record number of 100,000+ Sq ft transactions—strongest quarter for large deals since 2019.
→ Take-up surged to 3.2M, up from 2.3M in Q1 25, across all major reports – a good sign for all.
→ Regional cities (e.g., Manchester, Birmingham) also reported stronger Q2 take-up, especially for prime ESG-compliant offices.
→ Refurbishment-led supply boom delivered almost 2 million Sq ft in H1 2025, with pre-lets and ESG-compliant assets capturing the most demand.
Vacancy & Availability
→ Overall vacancy trended downward from 9.13% in Q1 to 8.67% in Q2, with availability around 23m Sq ft across London. Still above long-term averages of 18–19m Sq ft, but going in the right direction.
Investment Market
→ Investment volumes remain subdued compared to long-term averages, with investor focus on value-add and ESG-compliant assets.
Q2 2025 London Office Rent Trends
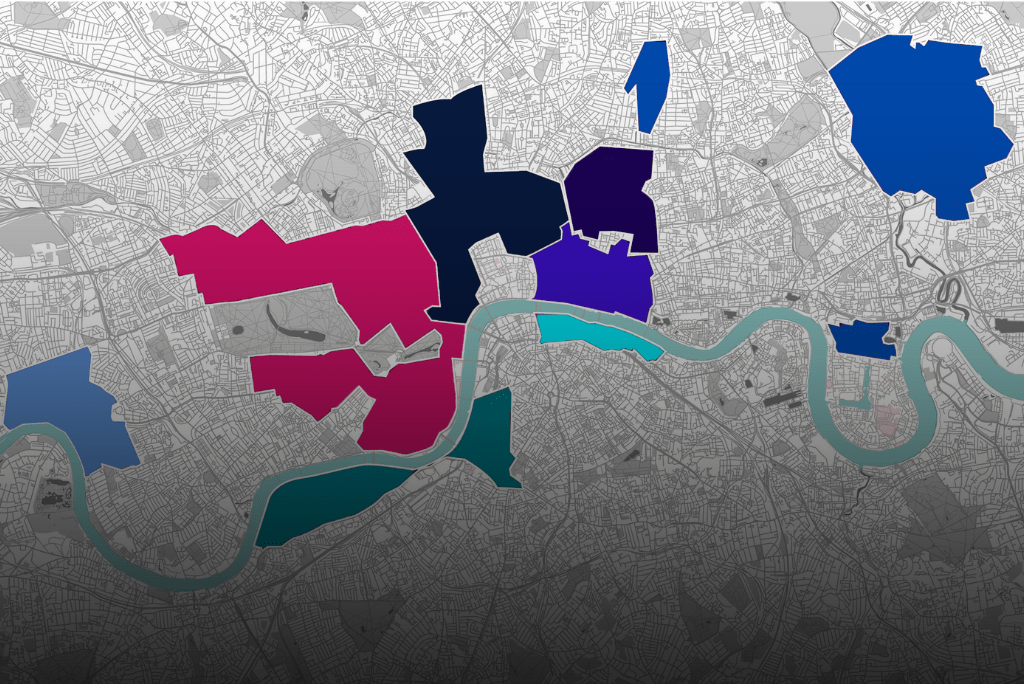
→ Average prime rents (£ per Sq ft) Q2 2025 by submarket
West End Core | Mayfair, St James’s
The West End Core, which includes Mayfair and St James’s, is still London’s most expensive office area. High demand for prestige space, especially from professional services and private equity, pushes top rents above £200 per square foot. While fringe areas offer better value and flexibility, the West End stands out for its high prices, limited supply, and prime location.
↑ Strong upward pressure persists; prime rents setting new records.
City Core | City of London, Clerkenwell, Farringdon
City Core areas, such as the City of London, Clerkenwell, and Farringdon, have seen a strong rebound in leasing, led by financial and legal firms. Grade A office rents average £100 per square foot, steady since Q1 and up 14.3% from last year, according to Knight Frank. Unlike fringe areas, the City Core’s rent growth comes from ongoing demand for high-quality, central offices.
Southbank | Waterloo, Southwark, London Bridge
Continues to attract media, tech, and creative occupiers. High-quality stock performs well, though the pipeline of speculative completions is growing.£ Area average Grade A fitted: £85; Unfitted: £75; Grade B: £45; Managed: £140; Serviced: £710/desk
→ Holding firm; demand remains steady but susceptible to supply shifts.
East London | Shoreditch, Stratford, Dalston
East London remains price-sensitive, catering more to startups, media firms, and cost-conscious corporates. Stratford offers large floorplates at the most affordable rates in Central London.£ Rents vary from £55–£65 psf, reaching £80 psf in best Shoreditch schemes.
→ Fringe markets remain attractive to budget-aware occupiers.
East London | Canary Wharf & Docklands
Supply remains ample. Flexible terms and amenities are key differentiators. Leasing activity has picked up due to relocations and value-driven demand. It also offers cracking amenities and connectivity.
£ Prime headline stable at £57.50 psf; Area average Grade A fitted: £55; Unfitted: £45; Grade B: £30; Managed: £125; Serviced: £640/desk
→ Price-conscious alternative to the City. Offers significant value and excellent connectivity.
Midtown | Holborn, Bloomsbury, King’s Cross
Demand in Midtown remains stable, benefiting from proximity to both West End and City. King’s Cross continues to outperform due to its placemaking efforts.
£ Average Grade A fitted: £88; Unfitted: £79; Grade B: £47; Managed: £155; Serviced: £788/desk
↑ Steady upward drift; benefitting from central connectivity.
South West London | Vauxhall, Battersea, Hammersmith
South West London, which includes Vauxhall, Battersea, and Hammersmith, offers cost-effective Grade A space as an alternative to the core markets. These areas attract companies looking for new buildings at lower prices than the City or West End, while still providing good locations and quality without the high costs.
£ Grade A fitted: £70–90; Managed: £90–135; Serviced: £550/desk
→ Fringe growth continues, but demand is more value-led.
→ Key London Office Deals of Q2
→ 404,000 Sq ft | 65 Gresham Street, EC2 | Squarepoint Capital | Pre-let
→ 195,000 Sq ft | 100 New Bridge Street, EC4 | State Street Bank | Pre-let
→ 192,000 Sq ft | 76 Upper Ground, SE1 | Lego | Pre-let
→ 107,000 Sq ft | 7 Brook Street, W2 | McDermott Will & Emery | Pre-let
→ 180,000 Sq ft | Centrium, 61 Aldwych, WC2 | LSE | Purchase
→ 70,000 Sq ft | Kova KX, Judd St, WC1 | LifeArc | Pre-let
→ 62,500 Sq ft | 30 Duke Street, St. James’s, SW1 | CD&R | Pre-let
→ Q2 market compared to our Q1 predictions
Q1 – Eyes on managed
For companies in between workspace decisions, shorter leasing options with a single monthly rate will keep attracting attention.
→ Q2 – Trend holds
There’s still strong interest in flexible and managed solutions, especially for companies in hybrid mode. Knight Frank notes a thin pipeline of prime space and continued demand for flexibility, but Q2 also saw a clear return to large traditional leases (e.g., Squarepoint Capital and LSE deals).
Q1 – Pent-Up Demand
Pent up demand may convert into transactions in H2, especially from occupiers who delayed decisions in recent years.
→ Q2 – Confirmed
Q2 saw conversion of delayed requirements into major deals, with the highest number of 100,000+ sq ft transactions since 2019 (Knight Frank/CBRE data).
Q1 – ESG = Critical Driver
Buildings with strong green credentials will continue to outperform both in terms of rental levels and take up. Location is key for decreasing footprint and increasing employee wellbeing.
↑ Q2 – Strengthening
ESG-certified, Grade A offices continue to dominate. Over 75–80% of Q2 take-up was new or refurbished space across all reports. Non-compliant older stock remains harder to let.
Quality Space
This trend is just getting started for occupier strategies, with strong demand for Grade A, ESG-certified space.
↑ Intensified
The “flight to quality” accelerated, with record prime rents in the West End and strong absorption of Grade A offices (e.g., 1.1m sq ft in West End Grade A, Colliers). Occupiers are willing to pay premiums for best-in-class space.
Q1 – Cautious but re-engaging market
Q1 set the tone for a cautious market that needs to rethink workspace and policies for getting teams together. There has been a clear branch off in demand between best-in-class space and everything else for some time.
We predicted the coming quarters are likely to see a more balanced return to activity across sectors as occupiers re-engage with the market and London companies continue to reverse remote working strategies.
→ Q2 – Still in progress
Showed more confidence and activity than Q1, but secondary space remains under pressure. Many landlords are repositioning assets with refurbishments to meet ESG and amenity expectations.
→ Predictions for the Rest of 2025
Take-up to remain above trend
H1 momentum suggests Q3 could see slower take-up, but H2 is expected to remain above trend due to ongoing corporate lease events.
ESG-led refurbishments will capture the majority of demand; secondary space continues to struggle. ESG-certified stock will maintain rental premiums. Refurbishment-led pipeline will make up a major proportion of completions (2–3m sq ft expected to PC in H2).
Rising central rents
Prime rents are expected to see continued upward pressure in the City and West End. Forecasts suggest a possible 5–6% annual prime rent growth in the City through 2029.
Flexible & managed growth
The “plug-and-play” managed model will remain attractive for mid-size occupiers seeking agility.
As we’re now into the second half of 2025, businesses will see a mix of rising rents in the most popular areas and good value in up-and-coming or fringe locations. With more focus on quality and sustainability, it’s a good time to look beyond just price and think about whether your space will work for you in the long run.
Whether you’re consolidating, upgrading, or moving, making sure your workspace matches your business goals will help you stay efficient and keep your team engaged in a competitive market.