Pre-letting and prime rents hit new highs, and the market has become even more divided as 2026 continues
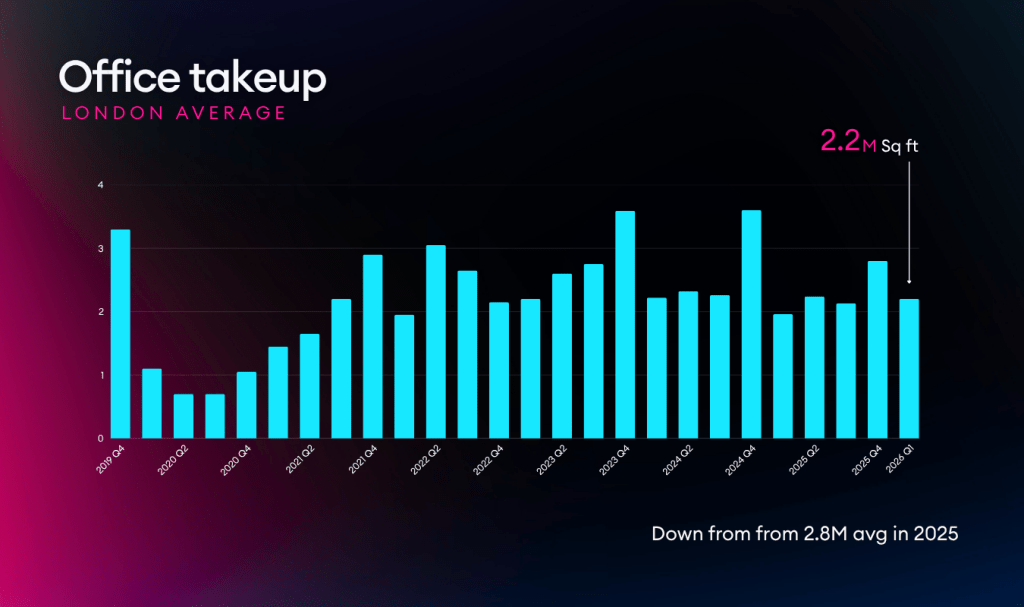
Central London office take-up remained strong in Q1 2026, with 2.2 million sq ft leased. This is 6% higher than Q1 2025 and close to the long-term average, according to published reports. Still, this headline number does not tell the whole story.
Pre-letting set a first-quarter record, with 738,000 sq ft committed before completion, and Grade A space comprised 92% of all leasing. City average prime rents rose 40% year-on-year to £130.80 per sq ft. Active demand hit 14.6 million sq ft, 57% above the ten-year average, while available space shrank in the most sought-after submarkets.
The divide seen in 2025 has grown. Larger companies in financial services, technology, and professional services are moving quickly and early. Smaller businesses, particularly SMEs, have grown more guarded due to wider economic uncertainty, leading deals under 10,000 sq ft to fall 25% compared to the Q1 average and reach their lowest point since 2021.
Below, we break down the main London office market numbers for Q1 2026 and explain what they mean for businesses considering their options.
Skip ahead to what you need:
– Key London market stats »
– London Office Rents & Rates Trends »
– Notable Q1 London office deals »
– SHB client results & sectors we moved »
Read on for the market stats to help support your next office move.
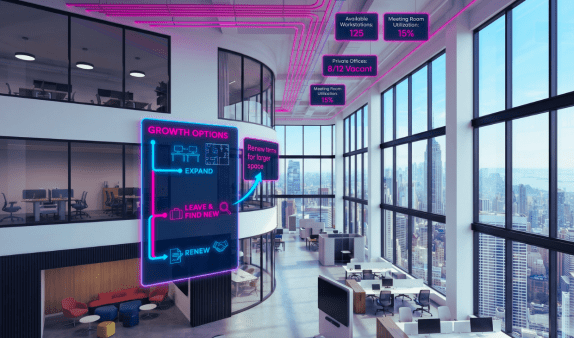
London office market snapshot
Q1 2026 saw record pre-letting, high City prime rents, tighter core vacancies, cautious SMEs, and subdued investment.
High-level stats across Central London offices | Q1 2026
High-level stats across Central London offices
• Average take-up: 2.2m sq ft
• Average vacancy rate: 7.1%
• Availability: 19.55m sq ft
• New/refurbished vacancy rate: 1.2%
• Active demand: 14.6m sq ft, record high, +57% on 10-yr avg
• City average prime rent: £130.80 psf, new record, +40% on Q1 2025
• West End average prime rent: £165.00 psf
Grade A & pre-let supply at record lows
Demand for top-quality space shaped occupier behaviour, with Grade A space at 92% of Q1 take-up and BREEAM Excellent or Outstanding buildings comprising 53% of leasing. Pre-letting hit a first-quarter high with 738,000 sq ft committed, a third of all space let.
Development completions in Q1 ranged from 1.1 to 1.4 million sq ft, but 61% of this new space was already pre-let before completion. Another 7.1 million sq ft is expected to be finished during the rest of 2026, bringing the yearly total to a record 8.5 million sq ft across 51 projects. However, about two-thirds of this space is already pre-let or under offer. Only 1.3 million sq ft of speculative space is still expected to arrive in 2026.
Some Q1 2026 reports confirmed that no large new Grade A floorspace will be available in any core Central London submarket until at least Q3 2027, and that is only if it has not been pre-let before then.
What this means
The market for Grade A space in key locations is now mostly a pre-let market. Businesses looking for new or fully refurbished, ESG-compliant space for 2027 or 2028 have fewer good options now than those who started their search six months earlier. To know what is truly available, under offer, or realistically deliverable, you need up-to-date intelligence, not just a general market summary.
Next steps for occupiers
• Start defining your business requirements and preferred timelines as early as possible, ideally 24-36 months before a lease event.
• Engage with an advisor to access live market intelligence and uncover pre-let or off-market opportunities.
• Schedule a market review to benchmark available options and costs in your target submarkets.
• Review your current lease terms and make a plan around upcoming break options or expiries.
• Consider sustainability and ESG priorities early to ensure all shortlisted options meet your long-term objectives.
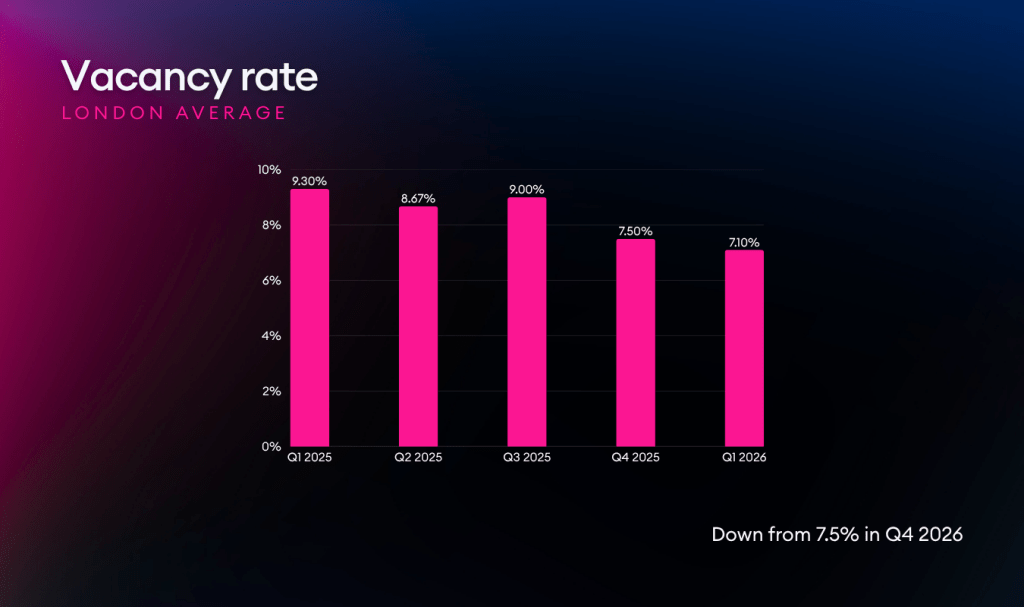
Vacancy rates stabilise as core tightens further
The blended Central London vacancy rate for Q1 2026 is 7.1% on average. Reports agree that vacancy in core submarkets is tightening, while fringe locations remain oversupplied.
The City Core vacancy rate came in at 6.0%, which is 210 basis points below its ten-year average. The West End Core (Mayfair and St James’s) had a vacancy rate of 4.1%, 100 basis points below its long-term average. In contrast, the Hammersmith vacancy was 22%, and the Vauxhall/Nine Elms/Battersea vacancy was 18%. Some Hammersmith buildings have received planning consent for change of use and are being removed from the office market.
Of the 38 active occupiers seeking over 100,000 sq ft, only 24 Grade A options are available now or within six months across Central London. Just three of those are in the City Core; six are across the West End’s central submarkets, two of which are already under offer.
Active demand reached a new record of 14.6 million sq ft, up 17% on Q4 and 57% above the ten-year average. 47% of active occupiers plan to expand their footprint; just 15% plan to downsize.
What this means
The overall vacancy rate suggests there are plenty of options, but submarket data tells a different story. For businesses searching in core Central London, including the City Core, Mayfair, King’s Cross, and Midtown, the real vacancy is much lower than the blended numbers suggest. If you rely only on market-level statistics, you may overestimate your real choices.
Access to detailed submarket data is critical. If you are unsure how to obtain or interpret these granular insights, our team can provide tailored reports and guidance for your target locations. Consulting with expert advisors ensures you have the most accurate and up-to-date picture of your actual options, helping you make more informed decisions.
Availability contracts as demand hits record levels
Total availability across Central London stood at a blended average of 19.55 million sq ft at the end of Q1, down 4% quarter-on-quarter, with early-marketed space falling 7%, the largest quarterly decline across any supply category. Some reports recorded 19.1 million sq ft, broadly stable despite 1.3 million sq ft of new speculative completions being absorbed during the quarter.
Supply fell across all five main Central London submarkets in Q1, with the exception of Southbank. The largest falls were in West End and Midtown, both down 7% quarter-on-quarter. 44% of available space (8.4 million sq ft) was BREEAM-rated Excellent or Outstanding, down 2% on Q4 2025.
Active demand of 14.6 million sq ft is now competing with a shrinking pool of space. The gap between what occupiers want and what is truly available in the right locations, quality and size keeps widening.
What this means
The available space may look large on paper, but most of it is in locations, buildings, or configurations that growing businesses are not seeking. The best options are often found through off-market and pre-market intelligence, meaning spaces that never officially become publicly available, especially for requirements in the 10,000 to 50,000 sq ft range in core Central London.
City prime rents hit a new record, rising 40% year-on-year
The average prime rent in the City rose to £130.80 per sq ft in Q1 2026, setting a new record and denoting a 40% increase from Q1 2025, as reported. This was also a 24% jump from the previous record of £105.26 per sq ft in Q4 2025. Seven City deals closed above £100 per sq ft this quarter, and a new top rent of £160 per sq ft was set.
The West End average prime rent held at £165.00 per sq ft, with the top West End rent of the quarter reaching £201 per sq ft (SoftBank, 77 Grosvenor Street, W1). New submarket records were set in Soho (£165 per sq ft, Paul Weiss at 20 Air Street, W1) and Covent Garden (£142.50 per sq ft, 90 Long Acre, WC2). A new South Bank record was also set, with Quantexa completing at £140 per sq ft at The Delft, SE1.
The difference between City and West End prime rents is now just 21%, the closest it has been in over 25 years. This reflects the growing demand for City tower space. The average Grade A City rent increased 15% year-on-year to £80.43 per sq ft.
Reports are forecasting prime rental growth of 4.3% per annum across Central London over the next four years.
What this means
A 40% year-on-year jump in City average prime rent is not a gradual change; it is a major shift caused by a real shortage of top-quality space. If your business has a lease event coming up, securing terms now through a pre-let or early commitment is one of the few ways to get cost certainty. If you are in space with above-market rent, it is worth comparing your current costs to what the market offers before your next break option. Our TERA platform can help track lease liabilities, and our advisors can highlight market comparisons using live rental market intelligence data.
For a detailed look at rents and business rates across London’s submarkets and available office types, review our guide below.
City prime rents hit a new record, rising 40% year-on-year
The average prime rent in the City rose to £130.80 per sq ft in Q1 2026, setting a new record and denoting a 40% increase from Q1 2025, as reported. This was also a 24% jump from the previous record of £105.26 per sq ft in Q4 2025. Seven City deals closed above £100 per sq ft this quarter, and a new top rent of £160 per sq ft was set.
The West End average prime rent held at £165.00 per sq ft, with the top West End rent of the quarter reaching £201 per sq ft (SoftBank, 77 Grosvenor Street, W1). New submarket records were set in Soho (£165 per sq ft, Paul Weiss at 20 Air Street, W1) and Covent Garden (£142.50 per sq ft, 90 Long Acre, WC2). A new South Bank record was also set, with Quantexa completing at £140 per sq ft at The Delft, SE1.
The difference between City and West End prime rents is now just 21%, the closest it has been in over 25 years. This reflects the growing demand for City tower space. The average Grade A City rent increased 15% year-on-year to £80.43 per sq ft.
Reports are forecasting prime rental growth of 4.3% per annum across Central London over the next four years.
What this means
A 40% year-on-year jump in City average prime rent is not a gradual change; it is a major shift caused by a real shortage of top-quality space. If your business has a lease event coming up, securing terms now through a pre-let or early commitment is one of the few ways to get cost certainty. If you are in space with above-market rent, it is worth comparing your current costs to what the market offers before your next break option. Our TERA platform can help track lease liabilities, and our advisors can highlight market comparisons using live rental market intelligence data.
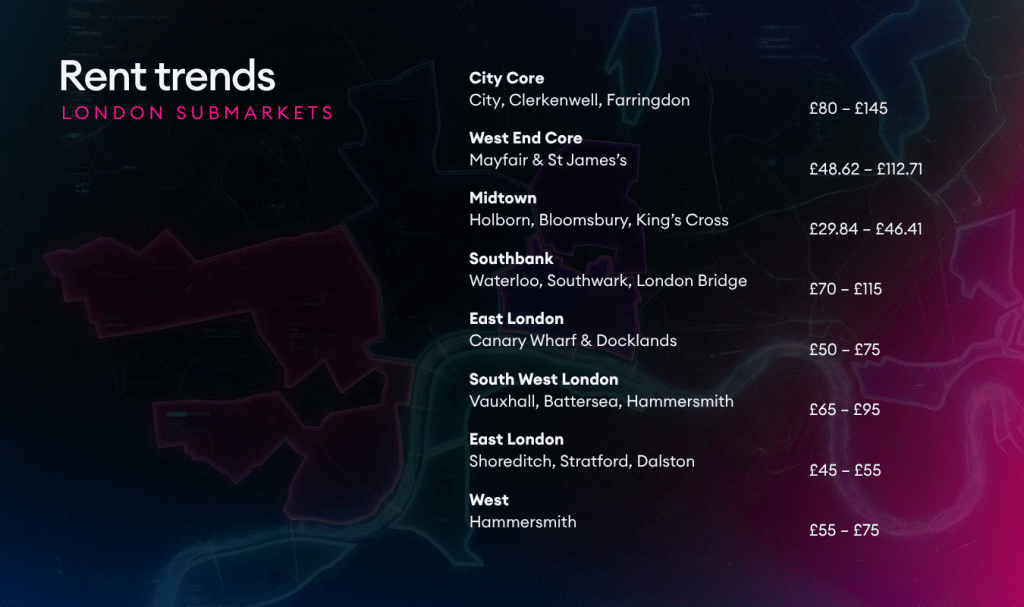
For a cheat-sheet of rents and business rates across London’s submarkets and available office types, review our guide below ↓
Find a deep dive on Q1 average rents and business rates by London submarket over here 🔗
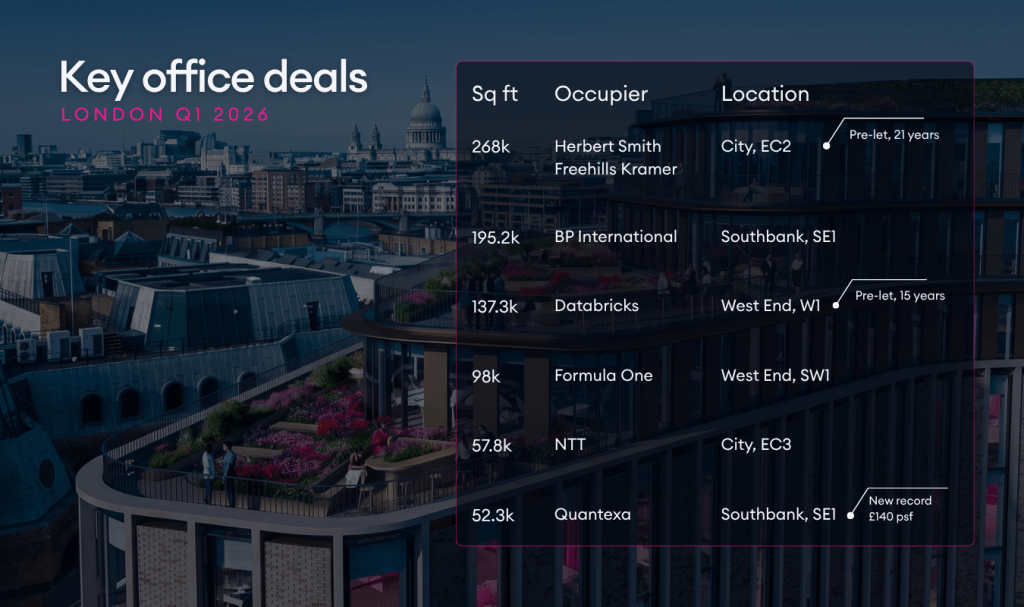
Notable Q1 2026 London office deals
The biggest deals in Q1 2026 show that occupiers are being selective with space. They are committing early, focusing on quality, and using real estate choices to show their planned direction.
Professional services firms in the City Core are signing up for buildings years before their current leases end, even for projects that have not started construction. Technology companies are using London pre-lets to support major international investments. Energy companies are moving quickly into new, high-spec Southbank buildings.
Herbert Smith Freehills Kramer | 268,000 sq ft | 1 Appold Street, Broadgate | City, EC2 | Pre-let, 21 years
BP International | 195,200 sq ft | The Ink Building, Timber Square | Southbank, SE1 | New completion |
Databricks | 137,300 sq ft | Network Building, Howland Street | West End, W1 | Pre-let, 15 years |
Formula One | 98,000 sq ft | 40 Broadway | West End, SW1
NTT | 57,800 sq ft | Fresh Wharf, 3 Lower Thames Street| City, EC3
Quantexa | 52,300 sq ft | The Delft, 5 Montague Close | Southbank, SE1 | New record rent £140 psf |
Herbert Smith Freehills Kramer signed a 21-year lease for 268,000 sq ft at British Land and GIC’s 1 Appold Street Broadgate redevelopment at £104 per sq ft, the largest Central London transaction since April 2025 and the largest law firm acquisition since 2022. Signed more than four years ahead of the firm’s existing lease expiry, the deal takes the building to 60% pre-let before construction has begun.
BP International took 195,200 sq ft of newly completed space at The Ink Building, Timber Square, SE1, the second-largest transaction of the quarter and a strong statement of confidence in the Southbank as a major corporate destination.
Databricks pre-let the entirety of Network Building, Howland Street, W1 on a 15-year lease, as part of a reported undertaking to invest $850 million in the UK over three years. The deal reportedly quadruples Databricks’ London footprint and establishes the building as its new EMEA headquarters.
Q1 2026 SHB client results
Money saved & sq ft exchanged
£ saved for clients in last 12 months
£ saved for clients in Q1 2026
desks acquired in Q1 2026
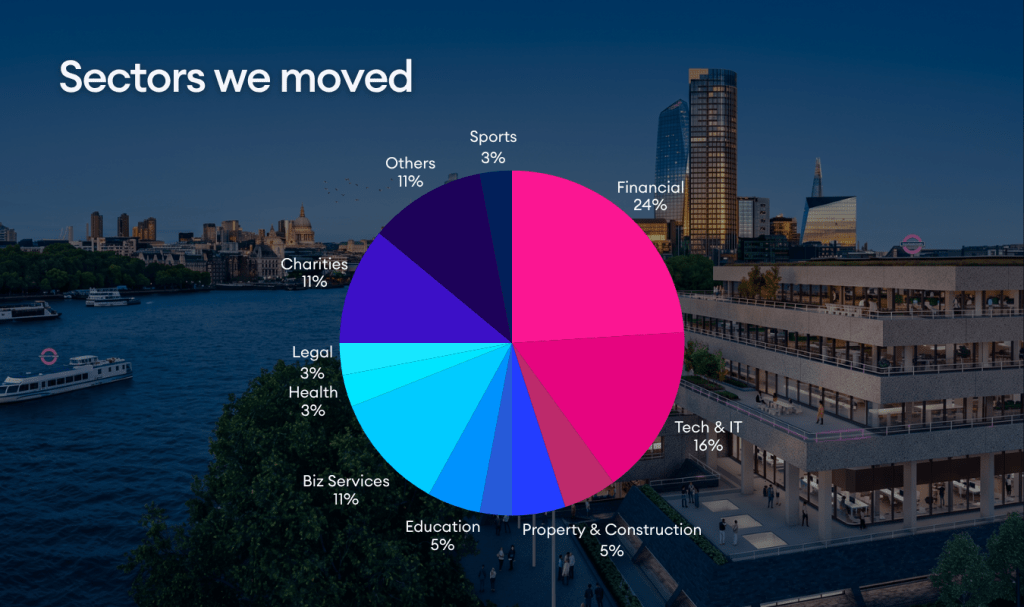
Sectors we moved | Q1 2026
In Q1 2026, there was a major shift in the sectors SHB worked with. Financial Services made a strong comeback, leading the quarter with 24% of deals, up from 14% in Q4 2025. Not For Profit also stood out, reaching 11% of deals, its highest share in over a year. Tech & IT stayed active at 16%, though down from its 31% peak in Q4.
Sectors we found offices for
Office market outlook for Q2 2026
Q1 2026 showed a clear trend: record pre-letting, record prime rents, and active demand far outpacing available supply in key submarkets.
The second quarter will depend on how quickly the current pipeline of requirements under offer turns into completed deals. With 2.8 to 3.8 million sq ft under offer across Central London at the end of Q1, and financial services occupiers expected to lead near-term leasing activity, Q2 leasing volumes could be the strongest of the year.
The market is still split into distinct segments:
→ Prime and newly completed offices continue to outperform on rent and absorption
→ Secondary and fringe stock faces steady structural pressure
→ SME and sub-10,000 sq ft demand remains cautious, reflecting larger economic uncertainty
→ The upward-only rent review ban, now law, changes the situation for every occupier facing a renewal, especially as prime rents have risen 40% year-on-year
If your lease event is in 2027 or 2028, Q2 2026 is the time to act. For those with renewals now, the advice you need has changed significantly. In both cases, the first step is the same.
Contact our team
If you have questions about offices, workspace strategy, or want to talk about opportunities in the current market, we are here to help.
Speak to the team +44 020 3514 8867 or fill in the form below.
Market commentary references published Q1 2026 reports. Vacancy and availability figures are blended averages from our research & insights and various sources, which differ because to respective market boundary definitions. All figures reference Q1 2026 (January to March 2026) unless otherwise stated.