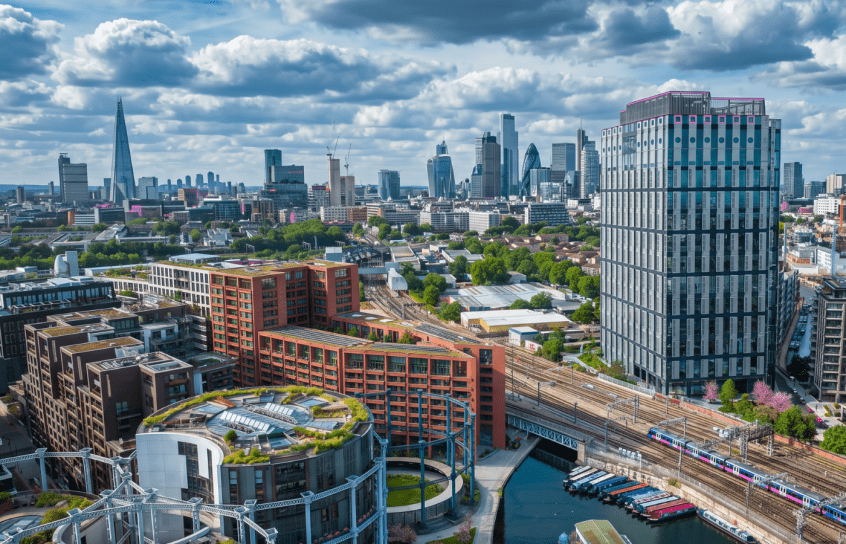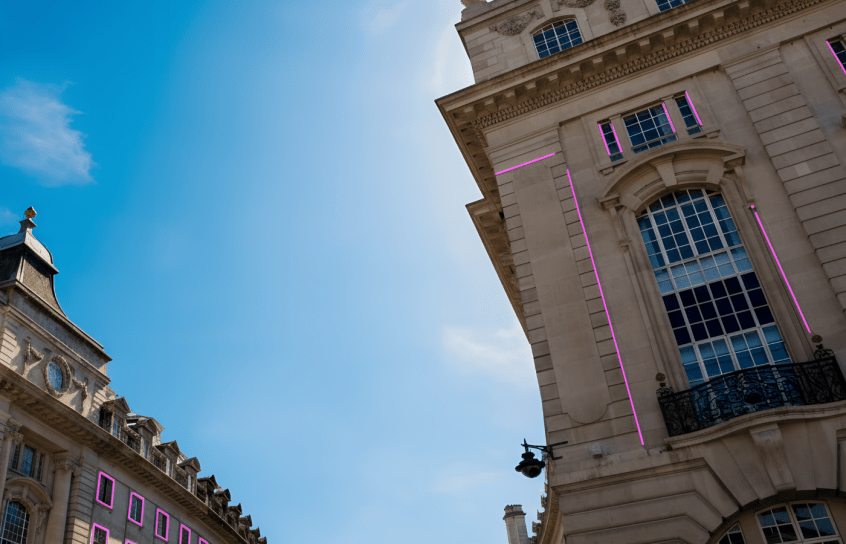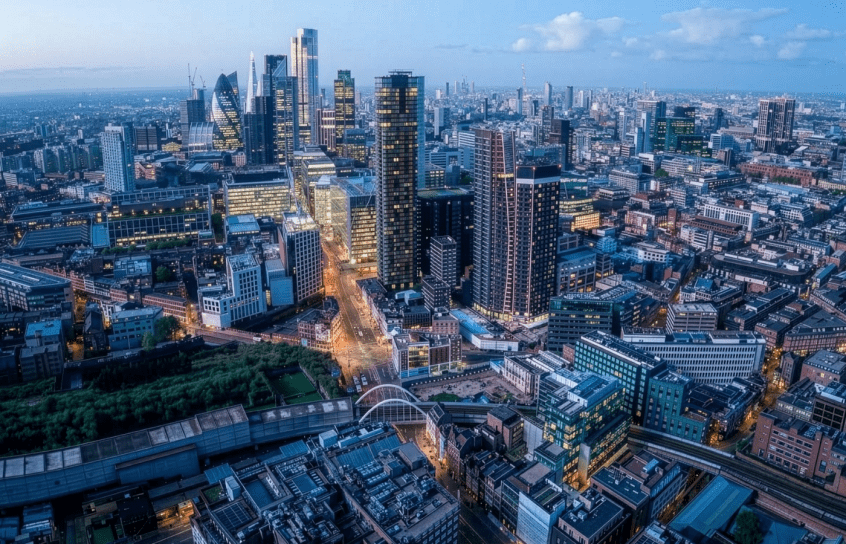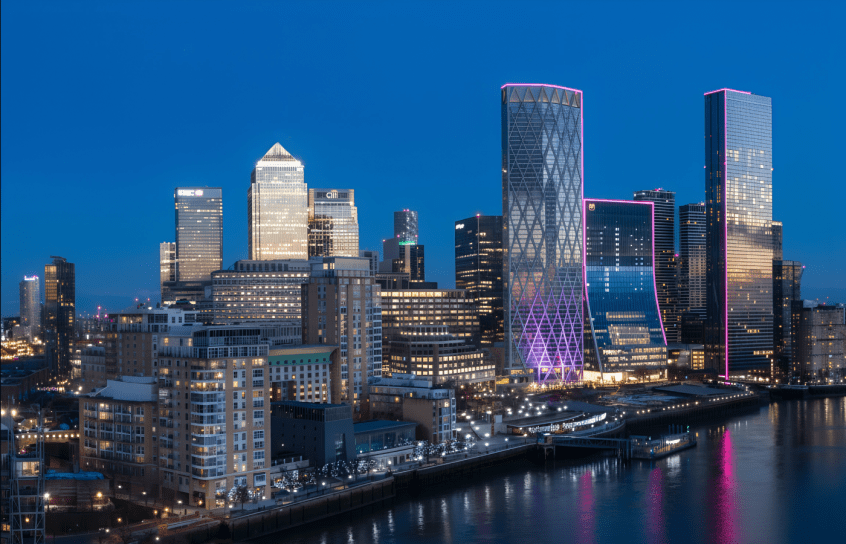
London’s office market picked up pace in Q2 2026
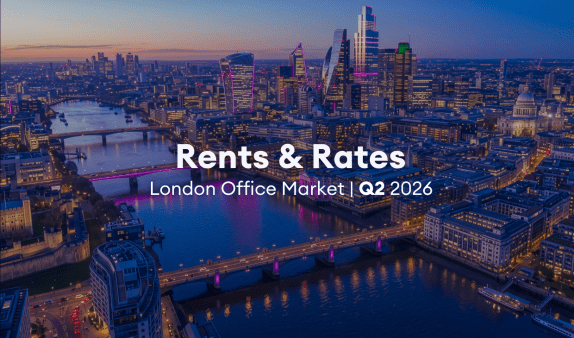
London’s office market picked up pace in Q2 2026 after a slower start to the year. Take-up increased, availability tightened, and demand kept shifting toward the best quality space available.
The West End had its best quarter in over two years, with most activity in Euston, King’s Cross, Fitzrovia, Soho, Covent Garden and Victoria.
We track the market, speak to hundreds of businesses monthly and have in-house data to draw on. With any workplace strategy, the right answer for each business depends on specific criteria and a forward-looking roadmap.
Here’s what changed between April and June, and what it means if you’re planning your next move.
Skip ahead
– Key London office market stats »
– London office rents & rate trends »
– Q2 London office deals shaping the market »
– SHB client results businesses we moved »
Q2 2026 saw the market rebound
AI companies led the way, the West End recovered, space became harder to find, and prime rents kept growing.
High-level stats across Central London offices
• Average take-up: 2.87m ↑ from 2.2m sq ft in Q1
• Average vacancy rate: 7.2% (blended average across London)
• Availability: 20.5m sq ft
• New/refurbished vacancy rate: average 1.5%
• Active demand: 14.3m sq ft, down slightly from last quarter’s 10 year high
• City average prime rent YoY: £100.00 psf blended rate across sources
Office take-up increased 19%
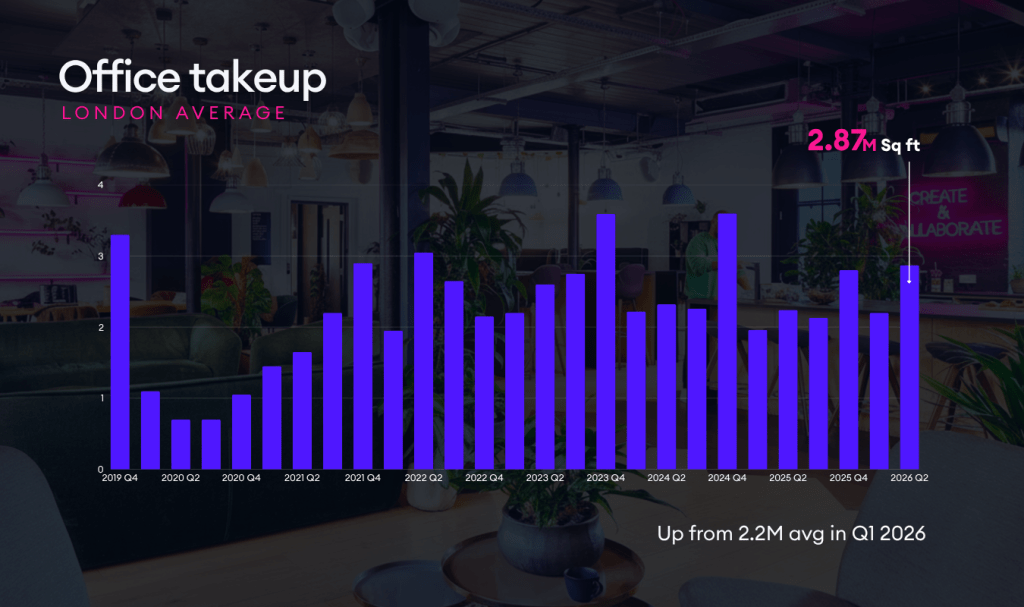
Take-up rose to 2.87 million sq ft in Q2, up from 2.2 million sq ft in Q1. Demand was broad-based, with AI and technology occupiers behind some of the largest deals of the quarter, as the sector’s requirement for space has more than doubled since the start of the year.
Grade A space was still the most popular, making up 76% of all leasing in Central London in Q2. This is up from 74% in 2025 and well above the ten-year average of 62%. Grade B and secondhand space made up only 12% of the market and continued to face demand challenges.
Technology and AI companies took 19% of all space, with Anthropic and OpenAI behind two of the four biggest deals. In the first half of 2026, AI take-up is said to have reached 705,371 sq ft, more than double the 2025 total of around 318,000 sq ft. King’s Cross, Euston and Fitzrovia are becoming AI clusters, alongside established hubs in Soho and Covent Garden.
What this means
More businesses are competing for the same pool of space, and popular buildings are moving faster than they were three months ago. Starting your search or renewal decision earlier than you might have done previously is now the safer approach. It’s worth understanding where genuine demand is concentrated before you commit to a location.
Vacancy edges up – core locations tighten further
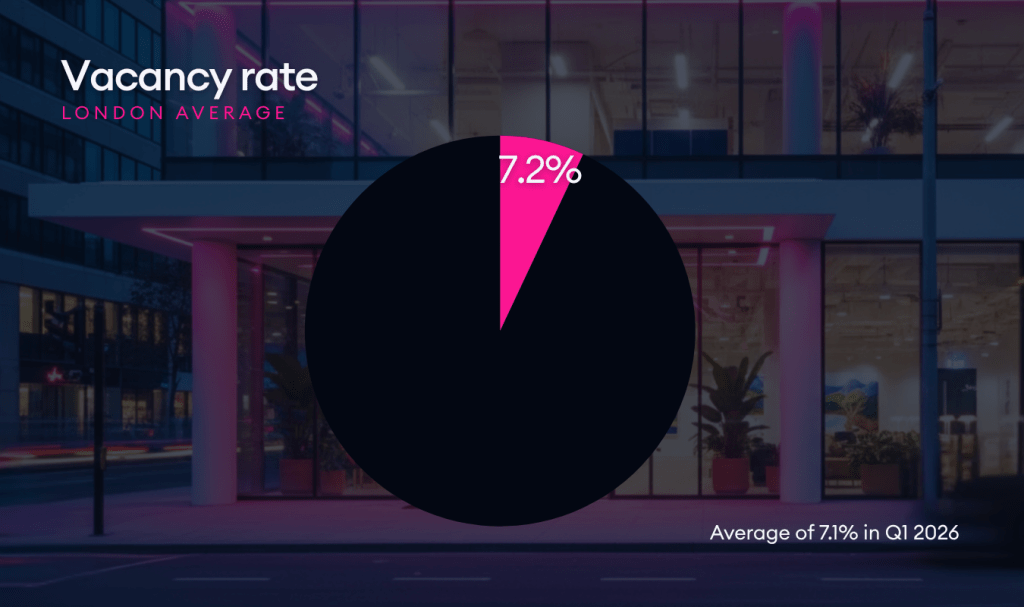
The blended vacancy rates stands at 7.2% for Q2. This is a Central London-wide average and, as with any blended figure, it smooths over some real differences between submarkets.
Within that headline, the picture varies by location. King’s Cross and Euston recorded a vacancy rate of 3.0%. West End Core stood at 5.8% and the City Core at 6.1%. Stratford came in around 24.6%, Vauxhall and Battersea at 17.5%, and White City at 17.9%.
New and refurbished vacancy across core Central London submarkets averaged 1.5% on blended data (Stratford noted separately at 18.0% due to structural fringe oversupply).
What this means for your business
Some submarkets carry more availability than others, meaning better pricing, stronger negotiating leverage and incentives for occupiers open to other postcodes. Review your specific target market to see how local vacancy will shape your next decision – contact our team for detailed information and advice here.
Availability tightened across Central London
Total availability came in at 20.5 million sq ft at the end of Q2, continuing the gradual tightening trend since the start of the year, driven by fewer completions and strong absorption of new space.
The fall was broad-based. All five main Central London submarkets recorded a reduction in availability in Q2.
With 3.7 to 4.1 million sq ft showing under offer at the end of Q2, the pipeline for H2 leasing looks healthy. A strong under-offer book entering the second half supports confidence in near-term take-up levels, even as new supply reaching the market remains limited.
What this means for your business
Good quality space is increasingly committed before it reaches the open market. Relying only on live listings means you’re seeing a shrinking view of the real picture. Off-market and pre-market intelligence matters more than it did twelve months ago, and it’s where an adviser can add the most value.
Average City prime rents reached £100.00 psf
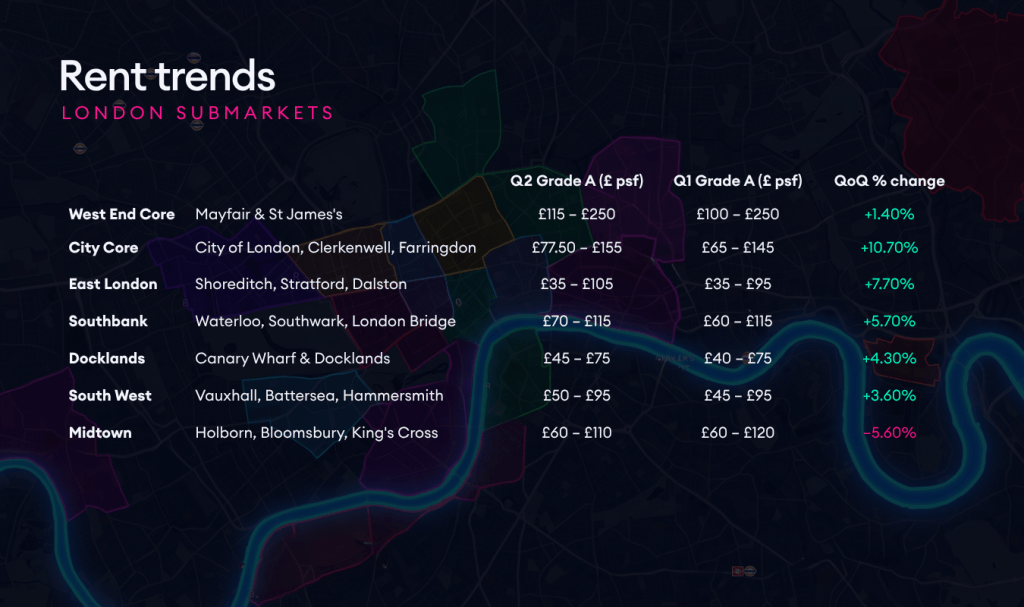
The average City prime rental figure reached £100.00 per sq ft in Q2. Prime rents across Central London have continued to move in one direction this year, reflecting sustained demand for the best-in-class space.
What this means for your business
This is now a real cost-planning benchmark for anyone budgeting a move into prime City space. Businesses that signed leases two or more years ago should get a current read on values before setting a budget. There’s typically more room to negotiate on secondary and refurbished stock than on anything at this prime tier. Early advice and direction is key to minimising exposure to new rent levels.
Detailed report of London office prices >
For a breakdown of rents and business rates across London’s submarkets and office types, see our guide below ↓
Notable Q2 2026 London office deals
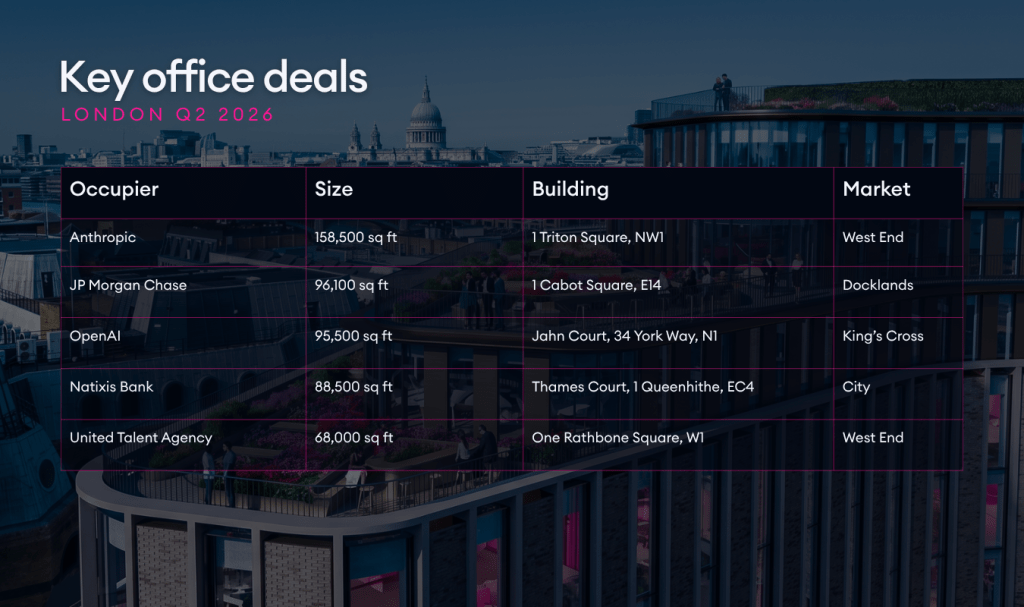
AI and technology occupiers signed some of the largest deals of the quarter, reinforcing King’s Cross, Euston and Fitzrovia as an emerging technology cluster alongside established hubs in Soho and Covent Garden.
→ Anthropic | 158,500 sq ft | 1 Triton Square, NW1 | West End | £97.50 psf
→ JP Morgan Chase | 96,100 sq ft | 1 Cabot Square, E14 | Docklands | Owner-occupier
→ OpenAI | 95,500 sq ft | Jahn Court, 34 York Way, N1 | King’s Cross | Pre-let £97.00 psf
→ Natixis Bank | 88,500 sq ft | Thames Court, 1 Queenhithe, EC4 | City
→ United Talent Agency | 68,000 sq ft | One Rathbone Square, W1 | West End
Q2 2026 SHB client results
Money saved & sq ft exchanged
£ saved for clients this year
Projects completed
£ saved for clients in Q2 2026
Sq ft of offices acquired
Advisory-led service mix
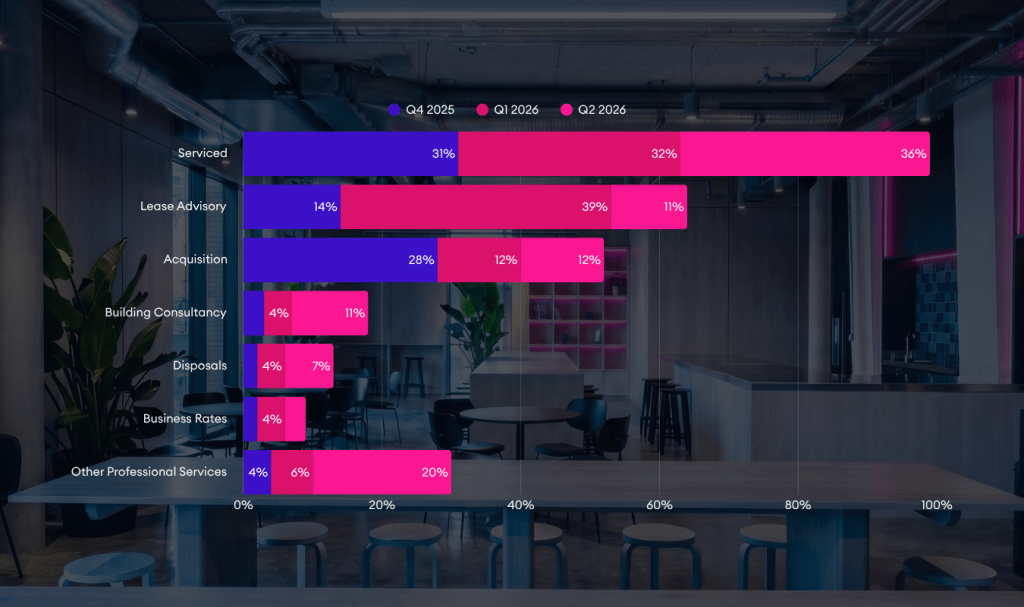
Advisory, consultancy and flexible office work have made up the majority of our work since late 2025. That continued through Q2, as occupiers increasingly ask whether their current space still aligns, their lease terms are competitive and whether gains could be made with a refreshed office or review of rates.
Lease Advisory projects continue and Stay v Go reports are progressing alongside our client’s timelines.
For businesses, the best advisory conversation isn’t just about what’s available in the market. It’s about understanding current costs, options and what the best outcome looks like across lease terms, fit-out, rates and any changes to space.
Businesses we moved in Q2 2026
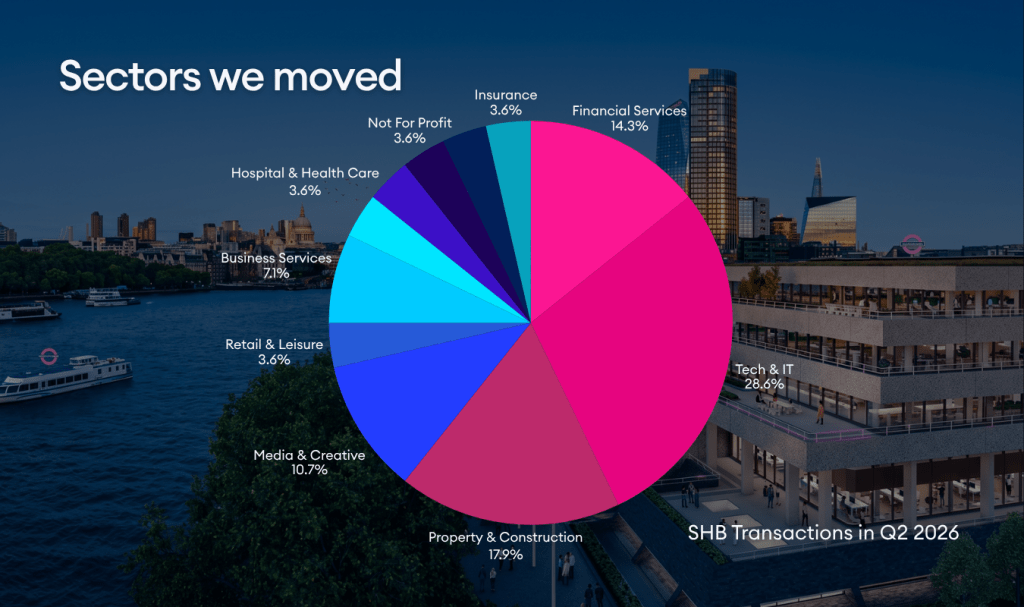
Tech & IT led our Q2 deals at 28%, reflecting the broader AI and technology surge in the market. Property & Construction followed at 18%, with Media & Creative at 11%.
Tech and IT returned to the top spot at 28%, matching the wider market trend. AI and technology companies were the main drivers of demand in Central London, and this sector led our transaction charts again.
Office market outlook for H2 2026
Q2 2026 showed London’s office market regaining confidence. AI demand shifted where activity was focused, and availability tightened across the main submarkets.
With 3.7 to 4.1 million sq ft under offer at the end of Q2, leasing for the second half of 2026 has a strong pipeline. Financial services and AI-related companies are expected to keep leading activity.
Key trends for 2026
The upward-only rent review ban, now law, continues to reshape the landscape for any occupier approaching a conventional lease renewal, at the same time as this prime-secondary gap keeps widening.
Occupiers approaching renewals need advice that reflects both shifts, and the wider advisory conversation is broadening to cover lease terms, fit-out, rates and workplace strategy, not just space search.



Let’s see where your office sits in the market
If your lease event is in 2027 or 2028, now is the time to act. For those with renewals this year, the advice you need has changed significantly.
In both cases, the first step is an impartial read of current space, needs and to see where the best opportunity is.
Speak to the team +44 020 3514 8867 or fill in the form below to ask any questions.
Market commentary references Q2 2026 intel. *City Prime Rent is calculated as a blended average across every core Central London source we track. Previous rent trend figures may include significant deals and premium space, not reflective of the whole market which was sub £100psf on average in Q1 2026. Vacancy and availability figures are blended averages from our research and insights and various sources, which differ due to respective market boundary definitions. New/refurb vacancy blended average excludes Stratford (18.0%) as a fringe outlier. All figures reference Q2 2026 (April to June 2026) unless otherwise stated.